The 2024 UK General Election, Ward by Ward
Using MRP to estimate how Britain voted in 7,993 wards.
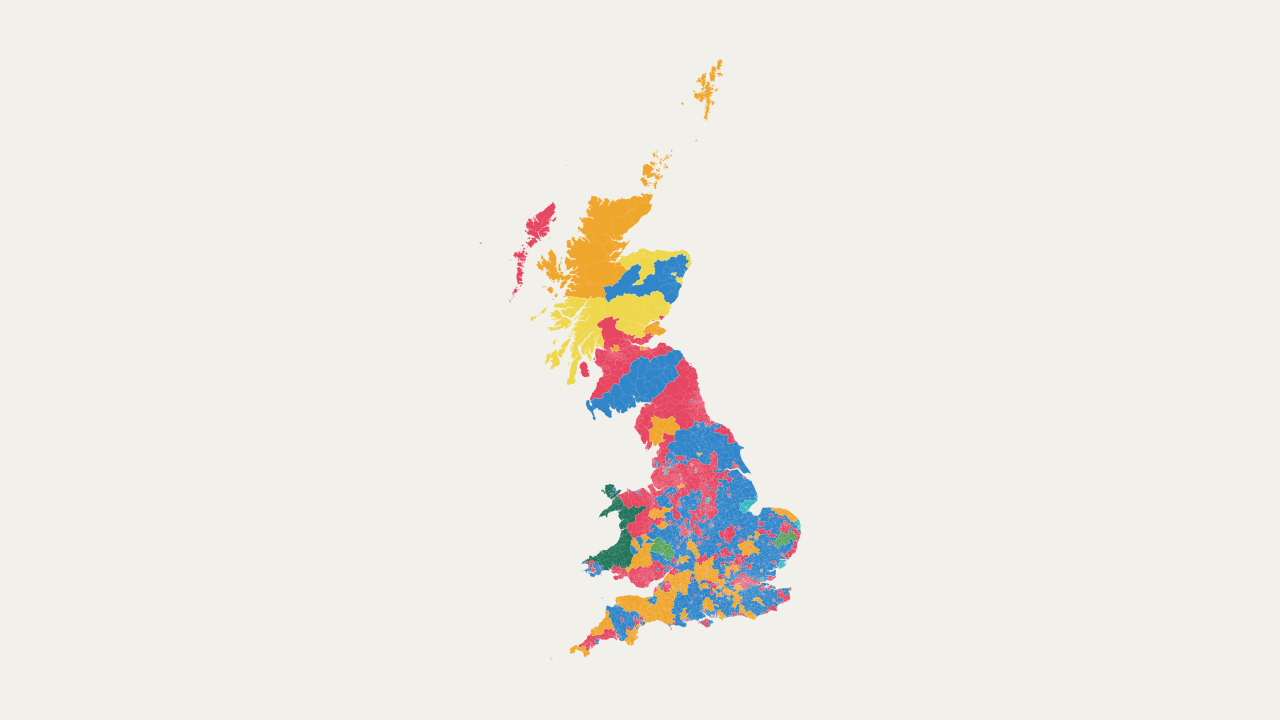
The 2024 general election was both the most fragmented and the most disproportionate in British history. Labour won a “razor-thin” majority, with almost two-thirds of the seats but only one third of the vote, while parties beyond Labour and the Conservatives gained more support than ever before.
We know how many votes each candidate received in each constituency. However, below that level, the picture becomes much less clear. Unlike Australia, which releases polling station-level results, the UK does not publish general-election votes below the constituency level. In fact, the country quite literally cannot provide polling-station results, since UK law requires that ballot papers from different boxes must be mixed before counting. Consequently, there is a lot that we do not know about the voting patterns of smaller communities.
The only way around this problem is to estimate lower-level results. With this in mind, I used multilevel regression and poststratification, or MRP, to estimate party vote shares in all 7,993 of Great Britain’s 2022 census wards. This approach combines tens of thousands of reported votes from the British Election Study with information from the last Census about each individual ward. First, I modelled vote choice based on age, sex, ethnicity, religion, education, housing tenure, socio-economic class, and economic activity, alongside constituency election results and information about respondents’ wards, constituencies, and regions. Next, I used this model to predict voting patterns, weighted those predictions to each ward’s demographic profile, then calibrated the ward vote counts to the known constituency results to produce local estimates consistent with the counts at constituency level. Note that I exclude Northern Ireland because of its different party system and because it is not included in the British Election Study data.
The interactive above shows the resulting estimates: search for a ward by name or select one on the map to explore its vote shares. Hopefully, these estimates will help researchers better understand political geography, help journalists describe local patterns of support, and help parties plan their campaigns. Remember, however, that these are only model-based estimates and, while I think that they are accurate overall, they might not always be right in some cases, so remember to take note of the 95% uncertainty intervals.
Related Reading
-

Taxing on a Curve
Why not replace the UK's system of cliff edge tax changes with a continuous income tax curve instead?
-
Just Use MMP
Mixed-Member Proportional Representation is the path of least resistance to electoral reform in the UK.
-

(Not So) Simple Systems
What is the rank-size principle and why should we care about the unit of competition at elections?